Accumulated Retention Graph
Note: This document is available in English and Portuguese. The English version is presented first, followed by the Portuguese version.
#### New Change:
- v1.8 - 2025-07-01 - UI Improvements

English
What is Accumulated Retention Graph?
Accumulated Retention Graph is an Anki addon that gamifies your learning by providing a visual representation of how your card states evolve over time. It allows you to clearly see whether you are adding new knowledge or consolidating what you have already learned.
How to interpret the graph:
The example graph illustrates a real study journey:
- The first sharp rise (near May 17) marks the beginning of a new study topic.
- Line
A (horizontal arrow at the top) shows a period where no new cards were added, causing the total growth to stagnate.
- Lines
B and C (diagonal arrows) reveal that, even without new cards, existing knowledge is being consolidated. The light green (Young) and dark green (Mature) areas are increasing, indicating that the cards are maturing and content retention is improving.
The graph also includes an orange ETK line (Estimated Total Knowledge) showing your average retention percentage on the right axis, providing insight into the quality of your knowledge retention over time using FSRS retrievability calculations.
The goal is to help you balance the growth of your card volume with the consolidation of existing knowledge. Future versions may allow customization of the interval ranges for each state.
Card States & Colors
- Blue (Retained): Cards with intervals > 84 days
- Dark Green (Mature): Cards with intervals 21-84 days
- Light Green (Young): Cards with intervals 7-21 days
- Orange (Learning): Cards with intervals ≤ 7 days or in learning phases
Português
O que é o Accumulated Retention Graph?
O Accumulated Retention Graph é um addon para o Anki que gamifica seu aprendizado, fornecendo uma representação visual de como o estado dos seus cartões evolui ao longo do tempo. Ele permite que você veja claramente se está adicionando novos conhecimentos ou consolidando o que já aprendeu.
Como interpretar o gráfico:
O gráfico de exemplo ilustra uma jornada de estudo real:
- A primeira subida acentuada (próximo a 17 de maio) marca o início de um novo tópico de estudo.
- A linha
A (seta horizontal no topo) mostra um período em que novos cartões pararam de ser adicionados, fazendo com que o crescimento total estagnasse.
- As linhas
B e C (setas diagonais) revelam que, mesmo sem novos cartões, o conhecimento existente está sendo consolidado. As áreas verde-claro (Jovem) e verde-escuro (Maduro) aumentam, indicando que os cartões estão amadurecendo e a retenção do conteúdo está melhorando.
O gráfico também inclui uma linha laranja ETK (Conhecimento Total Estimado) mostrando sua porcentagem média de retenção no eixo direito, fornecendo insights sobre a qualidade da sua retenção de conhecimento ao longo do tempo usando cálculos de recuperabilidade do FSRS.
O objetivo é, portanto, ajudar você a equilibrar o crescimento do seu volume de cartões com a consolidação do conhecimento existente. Futuramente, a ideia é permitir o ajuste dos intervalos de dias para cada estado.
Estados dos Cartões e Cores
- Azul (Retido): Cartões com intervalos > 84 dias
- Verde Escuro (Maduro): Cartões com intervalos de 21-84 dias
- Verde Claro (Jovem): Cartões com intervalos de 7-21 dias
- Laranja (Aprendendo): Cartões com intervalos ≤ 7 dias ou em fases de aprendizado
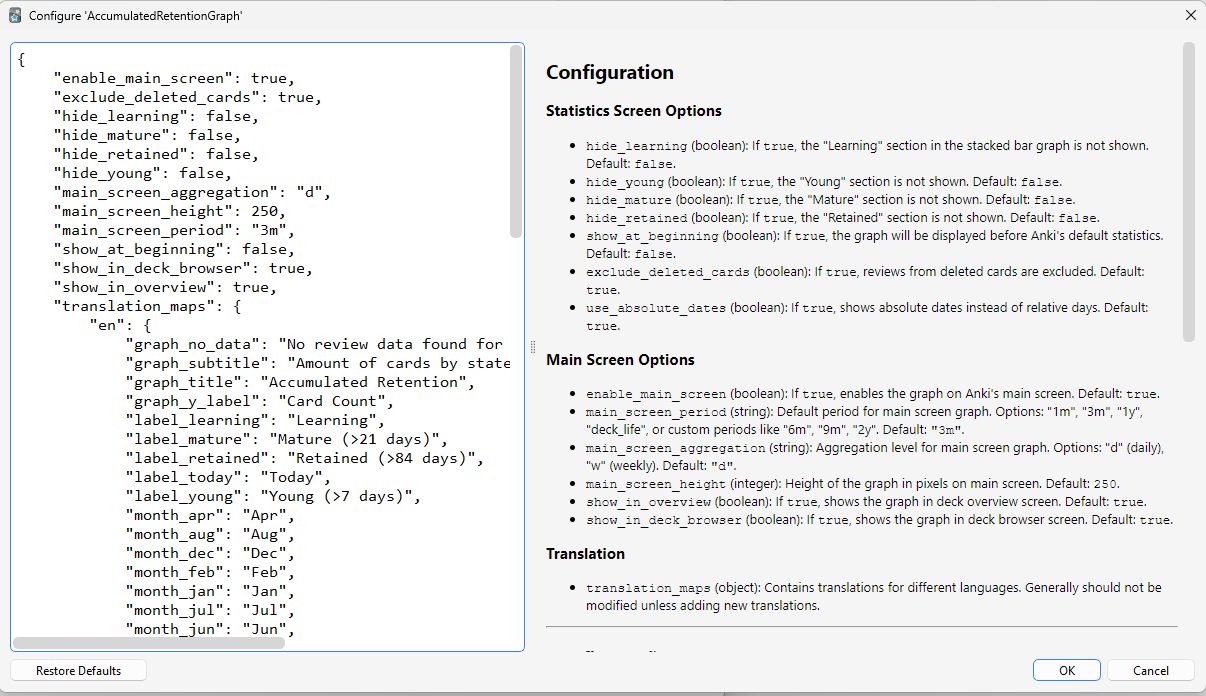
Configuration
License and Contact
Acknowledgments
- ETK Formula: Special thanks to Luc-Mcgrady. The ETK implementation uses the official FSRS retrievability formula R(t) = (1 + F * t/S)^C with parameters F=19/81 and C=-0.5, based on research from the Anki Search Stats Extended addon and the mathematical foundation from the ts-fsrs-memorized library. This provides accurate knowledge quality measurement using the same algorithm as modern FSRS implementations.
Changelog
- v1.8 - 2025-07-01 - UI Improvements
- IMPROVED: Hidden right Y-axis labels to reduce visual confusion with primary axis
- FIXED: Removed mispositioned Y2-axis label that appeared outside screen on main page
- ETK line functionality remains intact while improving graph readability
- v1.7 - 2025-06-26 - ETK Integration & FSRS Formula
- NEW: Added Estimated Total Knowledge (ETK) line overlay using official FSRS retrievability calculations
- NEW: Enhanced tooltips display both retention percentage and absolute ETK values
- v1.6 - 2025-06-20 - Anki 25.6+ Compatibility
- NEW: Added compatibility for Anki 25.6+ with new core migration (3.9 → 3.13)
- Prepared addon for future Anki versions while maintaining backward compatibility
- v1.5 - 2025-06-09 - Exclude Suspended Cards
- NEW: Added
exclude_suspended_cards option (default: true)
- Changed default
main_screen_period from "3m" to "2m"
- v1.4 - 2025-06-06 - Main Screen Integration
- NEW: Added graph display to Anki's main screen (overview and deck browser)
- NEW: Configurable main screen options: period, aggregation, height
- NEW: Individual controls for overview and deck browser display
- Improved translation system with automatic language detection
- Enhanced configuration documentation
- Default main screen integration enabled
- v1.3 - 2025-06-05 - UI/UX Improvements & Absolute Dates
- The graph's x-axis and tooltips now display absolute dates (e.g., "Oct 24") by default for better readability
- Added
use_absolute_dates configuration option (default: true)
- Standardized the "Today" label across all graph views
- Improved tooltip and legend rendering consistency
- Adjusted title and subtitle spacing for compact layout
- Fixed container border display issues in deck overview screen
- v1.2 - 2025-06-04 - Automatic Translation System
- Complete overhaul of translation system with automatic language detection
- Dynamic language support extraction from
config.json
- Added full Spanish support by default
- More robust system using native Anki functions
- v1.1 - 2025-05-28 - Exclude Deleted Cards
- Added
exclude_deleted_cards option (default: true)
- v1.0 - 2025-05-27 - Initial Release
- Stacked bar graph of card states over time
- Data aggregation based on statistics period
- Customizable card state visibility
- Tooltip display with detailed counts
- Basic internationalization (English, Portuguese)